How I use the Shared Clustering Tool

The other day, in the Facebook user group for the Shared Clustering Tool created by Jonathan Brecher, I saw a post about how different folks use the tool.  I mentioned capturing MRCA information and aligning it to the clusters, but thought I would expound here in a blog post.

Before I begin, I’m making one basic assumption for this post — that you’ve already started playing with the Shared Clustering tool yourself. 

First of all, I only use it for Ancestry matches at this time, primarily because that’s where I have the most matches (ditto for my mom and my dad) and because Ancestry currently doesn’t provide segment information.

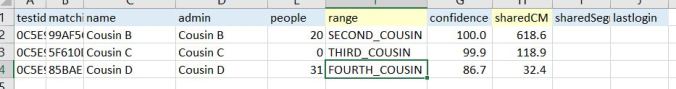
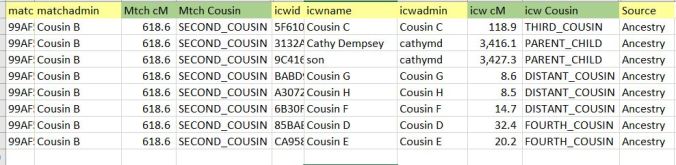
Secondly, although the tool offers the option of downloading match data directly from Ancestry, I do not use that feature.  Instead, I use the match and ICW (“In Common With”) files downloaded from Ancestry via DNAGedcom.com, which is, frankly, my go-to tool. 

DNAGedCom’s CSV files are my go-to files because I’m most comfortable using Excel – one of the reasons I like Shared Clustering, actually – and because that’s how I started, and I’ve kept on.   (Long story short, had I begun by using Ancestry’s Notes feature more effectively than I did, I could save myself some time, but I do it all in my DNAGedCom match file, and then update each subsequent download using VLOOKUP.)

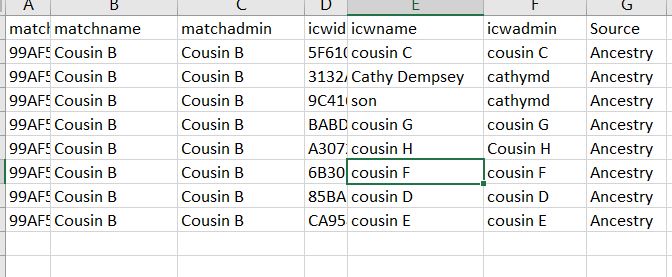
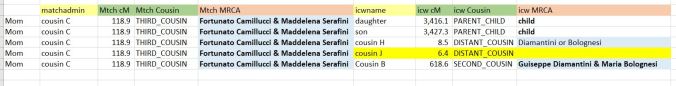
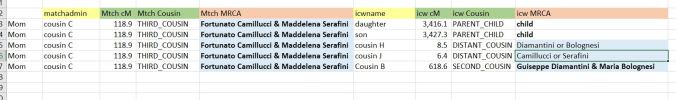
An example of tracking on my mom’s Ancestry DNA match list (via DNAGedCom) is shown below:

Mom_DNAGedCom_MRCA

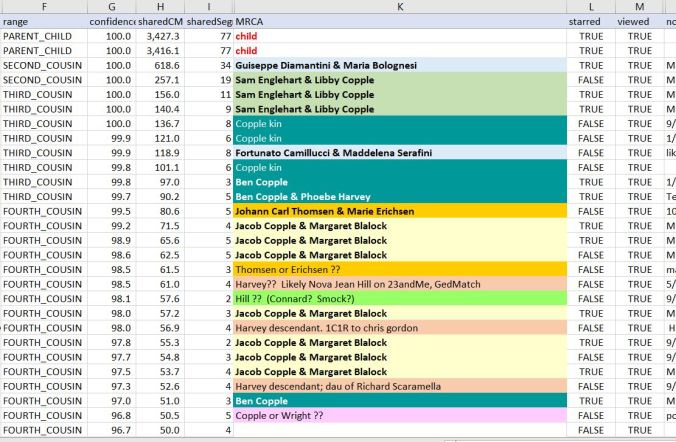
Color-coded by known MRCA.  If I’m not certain of the MRCA, based on the clustering, I add comments like “Copple kin” or “Hill?”

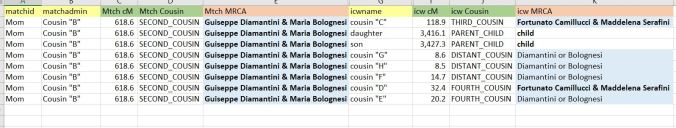
I upload the MRCA information to the completed Shared Clustering file via VLOOKUP since Jonathan has so nicely included the Test ID in the tool.  Usually, I will take the time to color-code the MRCA data in the Shared Clustering result file, simply so I can zoom out and easily see which cluster “belongs” to which possible MRCA.

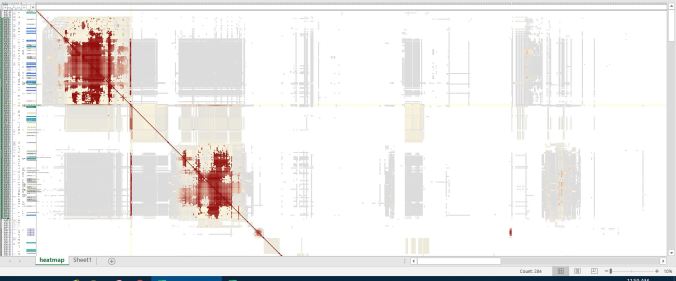
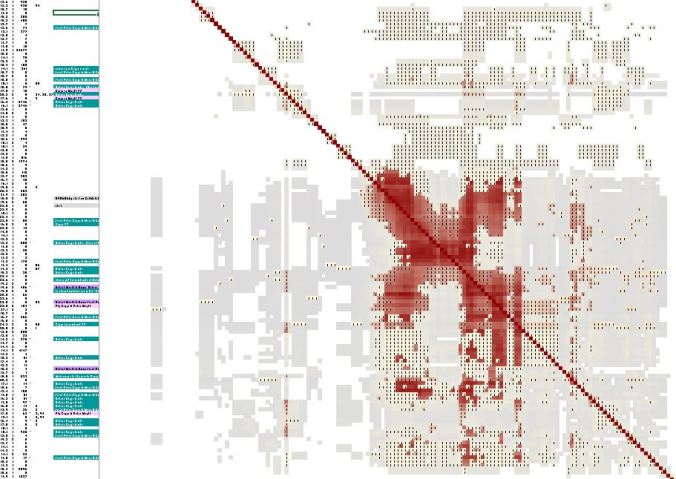
Below you can see where I’ve zoomed out to see a fairly large clustering of my matches.  I’ve zoomed out to 10% and have highlighted 284 matches.  Per Jonathan Brecher’s Wiki, the red color indicates likely shared DNA.  The gray color indicates that, although the two matches (one in the row and one in the column) do not share DNA with each other, they likely share with a third person.  You can also see (barely) my color-coded MRCA notes on the left side of the image.

Cathy_SharedMatches_1

So, let’s zoom in a bit on this large cluster.

Below, notice that I have highlighted in green (as indicated by the yellow arrows) one of my closest matches (although she is a 4th cousin 1 removed).  She and I share a common ancestral couple:  Jacob Copple and Margaret Blalock, my 4th great-grandparents.  We also share 3 segments of DNA, and two of those segments are indicated here, in the cluster of red at the top left, and the cluster of red (circled in yellow).  Note the vertical line of red that merges into a vertical line of green — the red is showing me that she and I share DNA with the bulk of the two circled groups.

Cathy_SharedMatches_4

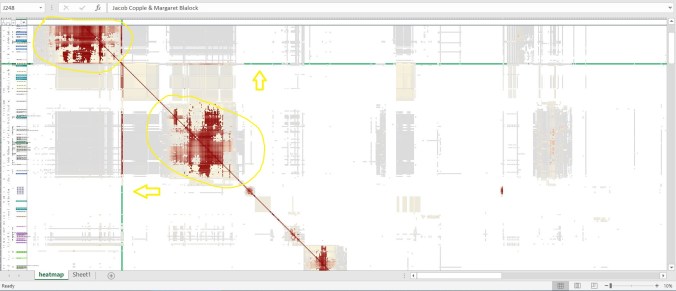
What does this tell us?  First it indicates two different segments of DNA, so if we go far enough back in time, it would be 2 different ancestors.   Second, she and I likely share those 2 segments of DNA.  Third, all the associated gray indicates a link between these 2 segments of DNA, so these matches are all most likely related to me via one ancestor and upstream of that ancestor.

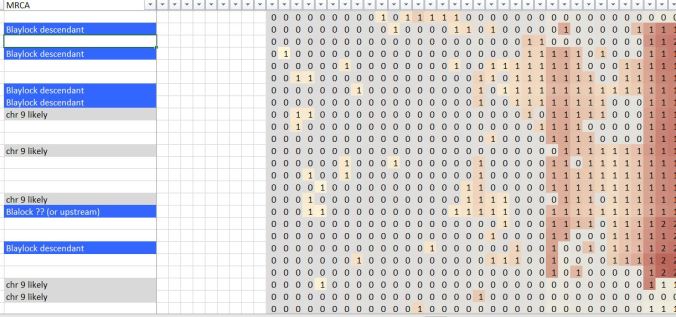
Let’s zoom in even further and look more closely, now at my MRCA/clustering information I’ve imported from DNAGedCom.  The blue labels refer to matches who are Blalock/Blaylock descendants.  The gray labels reference a known match on Chromosome 9.

Cathy_SharedMatches_2

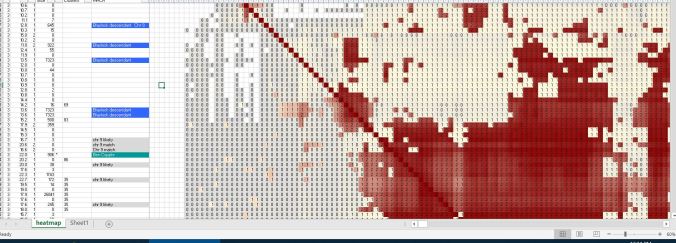
This would seem to point at the connection being on a segment of chromosome 9 and also relating to Margaret (Blalock) Copple.  This does not mean these matches share Margaret (Blalock) Copple as an ancestor with me, but rather one of Margaret’s own ancestors.

To put it another way, I have a clue!  These shared cluster results would seem to indicate that I need to do more research on Margaret (Blalock) Copple’s line, and connect with the matches who are Blalock descendants. And, at other DNA vendors, I should connect with matches who share the same segment on chromosome 9 to find out how or if they might be connected to a Blalock/Blaylock ancestor.

SharedClustering_Chr9

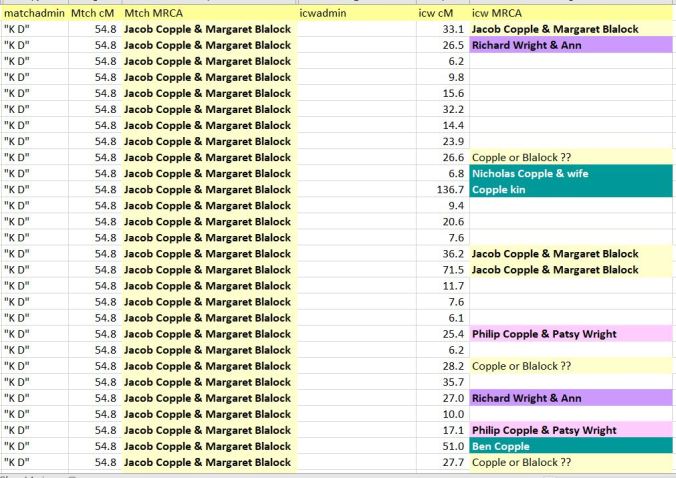
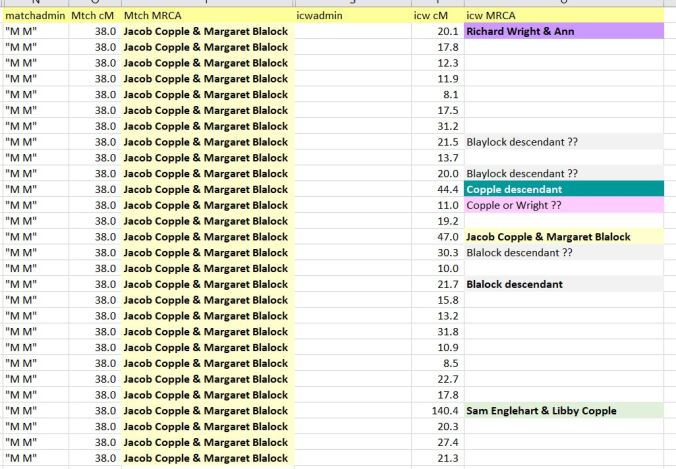
Let’s look at the second cluster, below.  This zoomed-in, partial view show matches who potentially share a segment on chromosome 13 with me.  Based on their Ancestry tree information, there are some who share Jacob Copple and Margaret Blalock as common ancestors with me (just one shown here).

SharedClustering_Chr13

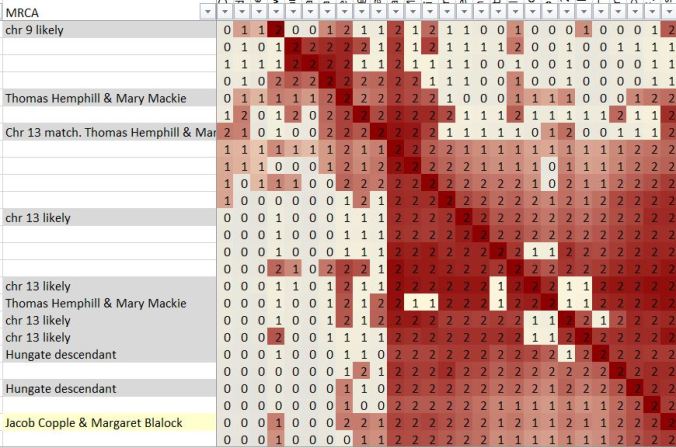
Other matches in this cluster have no Copple or Blalock at all in their tree.  Their trees could be incomplete or incorrect, of course (as could mine!)  OR, their trees could be indicating a shared ancestor further “upstream” (meaning, a possible ancestor of Margaret (Blalock) Copple.  To that end, I’ve noted where there are Hemphill and Hungate ancestors in my matches’ trees.

These Hemphill and Hungate families, according to the Ancestry trees of my matches, hailed from Kentucky (where Margaret Blalock was born ca. 1810) and a branch of the Hungate family ended up in Washington County, Indiana in the 1810’s – 1830’s.  This is the same county Margaret lived in during the same time frame.  Although not definitive, it’s worth noting as a potential clue.

In summary, because the two groups are related (as indicated by all the gray associated with them), both DNA segments the groupings indicate are more likely to have been inherited by me from Margaret (Blalock) Copple (and, ultimately, her ancestors) rather than from her husband Jacob Copple.

Here’s another example of a cluster on my Copple line, where you can quickly see, from the teal color on the left-hand side, that these matches share an MRCA.  In fact, I use the teal to indicate more than one generation of Copple ancestors (all also ancestors of Jacob Copple who married Margaret Blalock).

SharedClustering_COPPLE

The last example is a line from my dad’s side.  As with the Copple and Blalock lines from my mother’s side, this paternal line is rooted in the United States from at least 1800 if not decades before that. 

The bulk of these DNA matches share my third great-grandparents, Anderson Lamburth and Ermine Farley (or Farnham).  However, they are clearly grouped in two clusters, so that one set may share Lamburth DNA and another set Farley DNA, or “upstream” (as in Anderson’s mother and Anderson’s father, or Ermine’s two parents).

Most intriguing is the linking between the two clusters.  Not just the general gray, but the vertical red lines indicated by the blue arrow.  I need to look more closely at these two matches — their names will be in the column headers (not shown here for privacy reasons). 

One, they likely share 2 DNA segments with me.  Two, they clearly share DNA with the small cluster on the upper left, as well as the larger cluster on the lower right.  AND the folks in the middle who are only indirectly related (indicated by gray) to the two obvious clusters.

SharedClustering_LAMBURTH

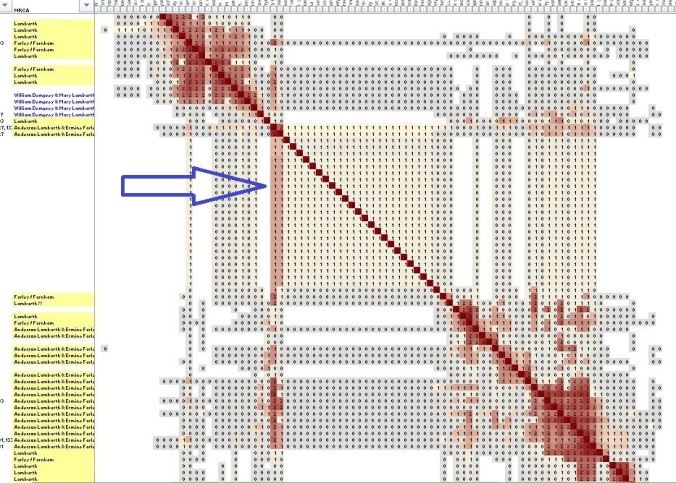
One other item to note in this cluster.  Some of the MRCAs are not highlighted in yellow.  That’s legit; referenced is the granddaughter of Anderson & Ermine, Mary (Lamburth) Dempsey, who was my great-grandma and her husband William. Clearly, the segment shared here relates to Mary rather than William.

If you use the Shared Clustering tool to visualize your Ancestry DNA matches, do you use any visualization aids to assign clusters to ancestors?  Perhaps you make better use of the Notes field than I do?


Cite/link to this post: Cathy M. Dempsey, “How I use the Shared Clustering Tool,Genes and Roots, posted 21 Oct 2019 (https://genesandroots.com : accessed (date)).


Clustering your Ancestry DNA matches with Excel (and DNAGedcom)

There are more and more good visualization tools available for clustering your DNA matches with the intent of discovering a new ancestor.  Recently I’ve been using a clustering tool created by Evert-Jan Blom at Genetic Affairs (more on that tool in an upcoming post). 

The DNA Color Clustering method used by Dana Leeds clustering methodology is straightforward, and especially effective for those persons who have many 2nd and 3rd cousin matches on Ancestry — which I don’t.  (Although it actually works quite well for more distant cousins, in my opinion, especially if you’ve been working on clustering your matches for several years!)  You can find out more about Dana’s method here.

Despite these cool clustering methods — and others — in the end, I keep returning to my trusty Excel spreadsheet and my list of “ICW” (In Common With) matches from Ancestry.com which I download using the DNAGedCom client tool (available here via a yearly subscription).

I’m sharing my way of clustering my matches — or, more specifically, my mother’s matches and my father’s matches — because the “best” method is the one that makes the most sense to you, or seems the most “intuitive”.

Mom_RitaShared

Some of Mom’s shared matches with “Cousin B”, on Ancestry

Let’s say I’m working with my mother’s DNA matches from Ancestry.com.  Using the DNAGedcom Client tool, I will download a list of all her matches, and then download a list of all her “ICW” matches into CSV format. 

Default ICW file

This is a sample of the default ICW file, before I combine it with the default Match file.

Default Match file

This is an abbreviated sample of the default match file.  The columns of interest are “Range” and “SharedCM”.

Once I have the two files, I use the VLOOKUP tool in Excel to associate (Cousin) Range and SharedCM to the primary match, and then to the In Common With matches.  The result is a combined file like that below.  The combined columns are highlighted in green.

Combined File

The “Mtch cM” and “Mtch Cousin” columns associate to Cousin B; the “icw cM” and “icw Cousin” associate to the ICW match: me, my brother, and cousins C, D, E, F, G, and H.  Shared cM (centiMorgans) = shared DNA; see my previous post here for more on centiMorgans. 

For purposes of clustering, though, all we really care about is that in general, the more DNA you share, the closer you are related — at least in the case of 2nd cousins or closer.  You can see that to some extent with Ancestry’s predicted ranges in the green highlighted columns.

The In-Common-With (ICW) list is basically a subset of your matches list.  My mom’s paternal first cousin — let’s call her “B” — has also tested at Ancestry.  So, Mom’s ICW list for “B” would include me, my brother, and six other cousins: C, D, E, F, G, H.  (Mom’s father was a first generation American, and “B”‘s father was born in Italy — not a lot of our Italian side, many still residing in Italy, have tested their DNA on Ancestry.  Hence, we don’t have a lot of matches.)  The critical point is that C, D, E, F, and G as well as my brother and I would show up on Mom’s match list AND on B’s match list — we are the “in common” matches.

So, if Mom and cousin “B” are first cousins, their Most Recent Common Ancestor(s) (MRCA) would be their shared set of (Italian) grandparents: Guiseppe Diamantini and Maria Bolognesi.  Obviously that same couple would be the great-grandparents of my brother and me.  But my brother and I are not the interesting cousins in the ICW cluster.  Cousins C, D, E, F, G and H are the key here. 

Mom_DNAGedCom_Example2

Let’s look at the example above.  I “cluster” my mom’s DNA matches by adding two columns (shown here highlighted in red).  Because I know my mom and Cousin B share the same set of grandparents, I put the MRCA couple’s name in the “Mtch MRCA” column for each row where there is an In Common With cousin.  (Note that, despite Ancestry’s prediction that my mom and Cousin B are 2nd cousins, they are in fact 1st cousins.)

The amounts of DNA shared, shown in the “Match cM” column and the “icw cM” column are the amounts Mom shares with these cousins.  We cannot determine from the information shown here how much, if any, “B” shares with “F”, or “C” shares with “D”.   We only know C, D, E, F, G, H not only share DNA with Mom, but MUST also share some amount with Cousin B because Ancestry has given us that information.

I then look at each of the ICW cousins: that is, my brother and I, plus cousins C through H.  I note that my brother and I are children, which means our DNA amounts won’t have any new information to determine cousin clustering — because whatever we share, we inherited from Mom.  (You can always exclude known children of a DNA match when you’re working with clustering, because they will always be a subset of their parents — if you have your parents or grandparents tested.)

Cousins C and D are two people whose place in my mother’s family tree I already know — therefore I include their MRCA information (Fortunato Camillucci and Maddelena Serafini).  They are my mother’s cousins on her Diamantini line.  Since the Diamantini line is my mother’s paternal line, I shade it blue for male.

Cousins E, F, G and H are unknown to me.  In this case, none of them have trees on Ancestry which might give me more detailed information as to how they relate to my mother.  The amount of DNA shared is fairly small, so it is possible the Most Recent Common Ancestor (MRCA) with Mom is quite a few generations back.  So I note them as “Diamantini or Bolognesi” (as I don’t yet know whether they share on the Diamantini line or the Bolognesi line) and also shade the cell in blue.  I leave those notes unbolded, since I’m not certain of how the cousin actually fits into our tree.

I then do the same thing with each of the other cousins listed here.  Below is a screen shot of the In-Common-With listing for Mom and Cousin C.  Note that there is some overlap with the In-Common-With listing for Mom and Cousin B, but there is one person who shares DNA with Mom and Cousin C, but who does not share with Cousin B.  I labeled that person Cousin J (highlighted in bright yellow.)

Bree_DNAGedCom_Example1Because the Most Recent Common Ancestor between Mom and Cousin C is the Camillucci & Serafini couple, I then use those names to populate the cell in the icw MRCA column, as shown below.

Bree_DNAGedCom_Example2

Mom doesn’t have that many matches on Ancestry.com to her paternal side, in part because her father was a 1st generation American.  A better example of the clustering is shown below, with one of her 4th cousins.  The shared Most Recent Common Ancestor between Mom and cousin “K D” is Jacob Copple and Margaret Blalock.

Cousin KD

I have hidden the names of the In-Common-With cousins, but you can see the amount of DNA they share with my mother.   What this screenprint shows is how the different In-Common-With cousins have different Most Recent Common Ancestors with Mom.  But all of them are related in some way to either Jacob Copple or Margaret Blalock.  Philip Copple and Patsy Wright, for instance, are the presumed parents of Jacob Copple.  Patsy Wright’s presumed grandparents are Richard Wright & Ann.  Ben Copple is the son of Jacob Copple & Margaret Blalock, while Nicholas Copple & wife are the likely paternal grandparents of Jacob’s father Philip.

A different cousin of Mom’s who also descends from Jacob Copple & Margaret Blalock possibly inherited some of Margaret (Blalock) Copple’s DNA.  You can see that in the ICW MRCA column below, where some of the In-Common-With cousins (names are whited-out) appear to have Blalock / Blaylock lineage.  One of the cousins who shares DNA with both Mom and “M M” is fairly closely related to Mom; you can tell that by the amount of DNA shared (140.4 cM) and the MRCA = Sam Englehart and Libby Copple.  Libby Copple is the granddaughter of Jacob Copple & Margaret Blalock.

Cousin MM

All in all, this is just one more method of using color coding and Most Recent Common Ancestor information to figure out how your unknown matches may be related to you.  It’s not an absolute — it’s just a hint.  But it gives you something to work with.